The results are surprising, Quality Score and Cost Per Click are more clearly correlated when you look at Exact Match keywords.
Short answer: CPC does not directly affect Quality Score.
Quality Score influences CPC through Ad Rank, not the other way around. However, when you analyze real account data at scale, CPC and Quality Score often appear correlated, especially for Exact Match keywords.
This article breaks down where that correlation is real, where it’s misleading, and what actually matters if you’re trying to lower CPC through Quality Score improvements.
Table of Contents
How Quality Score and CPC Are Actually Related
The Google Ads quality score is a diagnostic tool meant to help you improve your Ad Rank.
Therefore, advertisers often strive to optimize their campaigns to improve Quality Scores and enhance the overall effectiveness of their online advertising.
Google Ads continues to change, so in this case study I set out to explore more broadly how Quality Score works with Cost Per click.
The results are surprising, Quality Score and Cost Per Click are more clearly correlated when you look at Exact Match keywords. Broad Match keywords seemed the have the smallest measurable correlation.
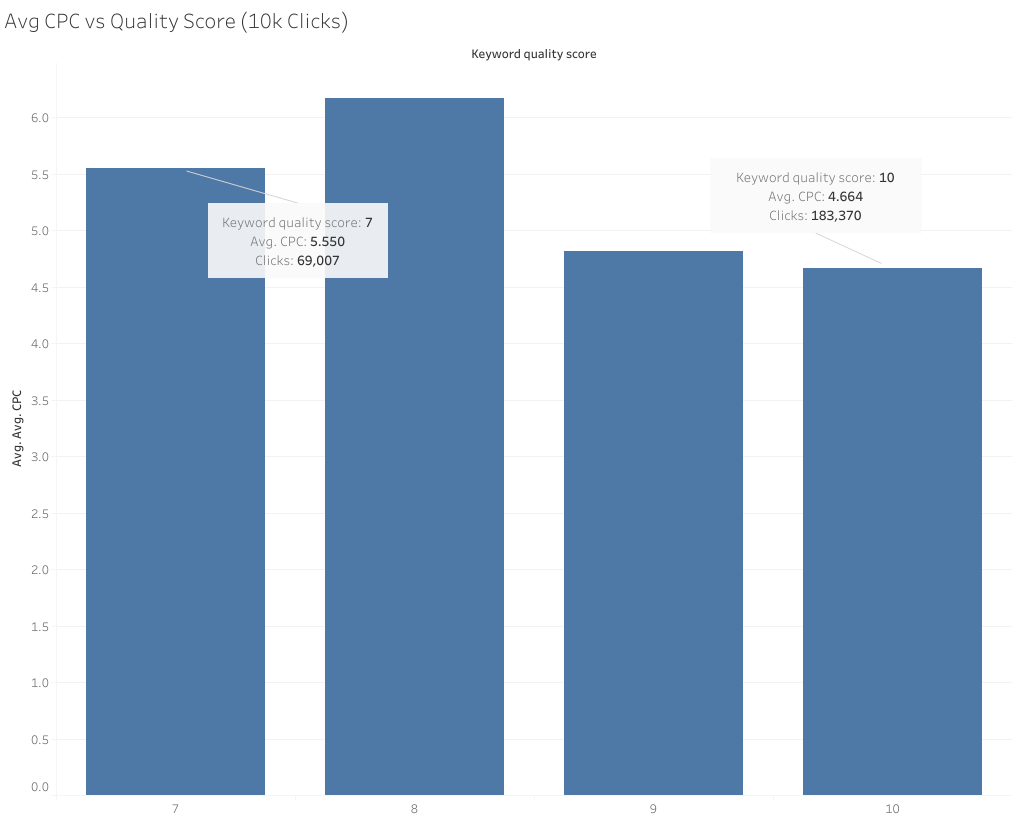
Broad Match Quality Score vs Avg CPC (10k clicks)
In the first visualization, we looked at the keyword data for 299,916 clicks, Exact Match, Phrase Match, and Broad Match. The keywords had to have more than 10,000 clicks to be included in the dataset.
The data illustrates that there is a subtle variation in the Cost Per Click (CPC) corresponding to different Quality Scores.
While the general pattern suggests a correlation between Quality Score and CPC, the specific dynamics between Quality Scores 8 and 10 reveal interesting variations, emphasizing the need for a nuanced understanding of the relationship between Quality Score and Cost Per Click.
To quantify these variations, we can calculate the percentage changes in CPC from one Quality Score to another.
These percentage changes provide a more quantitative perspective on the observed trends. Concerning Broad Match Keywords, the CPC increases by approximately 11.27% when transitioning from Quality Score 7 to 8, indicating a moderate upward trend. In contrast, there is a notable decrease of about -20.53% in CPC when moving from Quality Score 8 to 10, suggesting a potential cost reduction associated with a higher Quality Score.
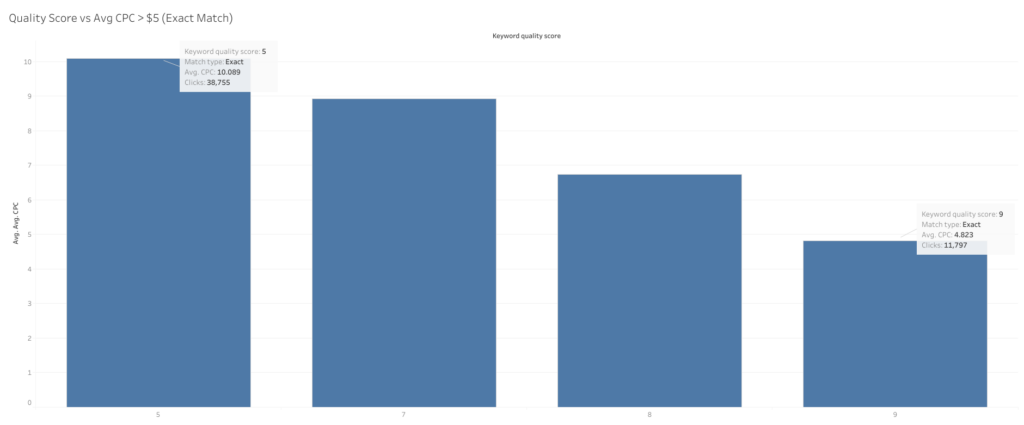
Exact Match Quality Score vs Avg CPC (>$5)
The challenge with the initial visualization arises from the varied distribution of costs associated with each keyword. In typical AdWords accounts, keywords don't span the entire 1-10 range but tend to cluster in specific intervals, like 5-7 or 8-10 for brand terms. Without proper filtering, the inherent relationship may be unclear. To mitigate this, I refined the results by focusing on Exact match keywords with an average CPC above $5, resulting in a sample size of 183,006 clicks.
Upon implementing filtering, a significant trend becomes apparent. Notably, when we focus on exact match keywords, the results become more elucidating. For instance:
Exact match keywords with a Quality Score of 5 exhibit an average CPC of $10.089.
Quality Score 7 correlates with an average CPC of $8.929.
Quality Score 8 is associated with an average CPC of $6.735.
Quality Score 9 reveals a CPC of $4.82.
Calculating the percentage changes between these Quality Scores provides further insights into the nuances of the relationship:
These percentage changes highlight the diminishing costs associated with higher Quality Scores, reinforcing the importance of refining the analysis through precise filtering to uncover more meaningful insights.
Quality Score is based on historical impressions for exact searches of your keyword, therefore changing keyword match types will not impact Quality Score.
Google states that the quality score is solely influenced by exact match variants in the alignment between a search phrase and a keyword. In theory, match type should be irrelevant to the quality score.
Broad match types can bid on search phrases that are not exact matches, with potentially weaker quality scores, thus influencing their average cost per click. Quality Score itself does not influence CPC, it's the relationship between the keyword and search term that matters.
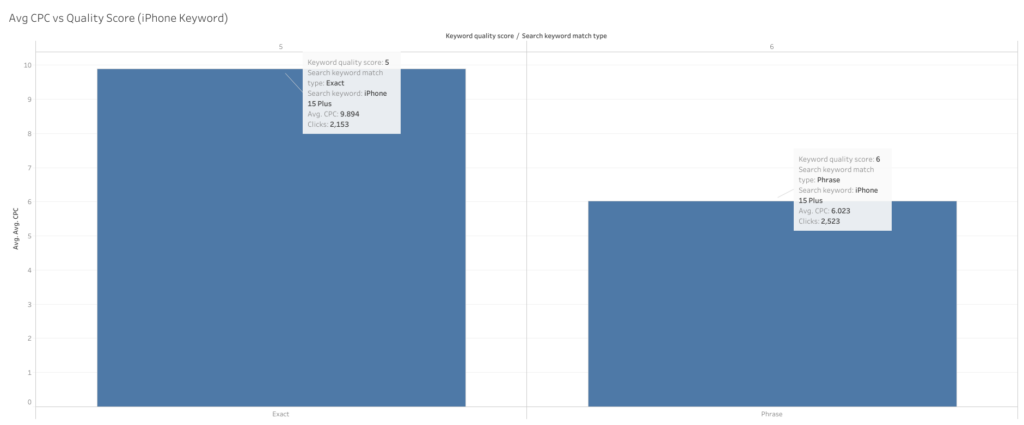
Quality Score vs Avg CPC (Keyword = iPhone 15 Plus)
In the above two visualizations, we saw little change in Avg CPC when we included Broad Match keywords. In the next visualization, we will include both Exact and Phrase match keywords for a single keyword.
Digging deeper, I honed in on a specific keyword: "iPhone 15 plus." Due to the aforementioned limitation, that most quality scores for a given Adwords account will fall within a small range, our data is confined to quality scores 5 and 6.
This makes sense as a keyword's quality score wouldn't logically fluctuate widely.
The total sample size was 4,676 clicks.
For Quality Score 5, the average CPC was $9.89, while for Quality Score 6, it dropped to $6.023, indicating a decrease of approximately -39.14%.
Conclusion
CPC does not drive Quality Score. Quality Score influences CPC indirectly through Ad Rank. The apparent relationship between the two only becomes visible when you control for query intent and match behavior.
What changes across match types is not the keyword itself, but the range of search queries Google is permitted to match.
Exact Match keywords remain tightly aligned to user intent. Because relevance is preserved, improvements in Quality Score translate into meaningful and consistent CPC reductions.
Phrase Match allows limited expansion, introducing some variance but generally maintaining intent integrity.
Broad Match expands aggressively into non-exact queries and broad semantic territory. This weakens relevance at the query level, diluting the observable relationship between Quality Score and CPC.
When Broad Match keywords are included, the correlation between Quality Score and CPC appears weak or inconsistent. Once the analysis is constrained to Exact Match keywords with sufficient cost density, the relationship becomes clear and statistically meaningful.
Across 183,006 Exact Match clicks, CPC declined materially as Quality Score improved:
Quality Score 5 → 7: −10.89%
Quality Score 7 → 8: −24.61%
Quality Score 8 → 9: −28.38%
On average, each Quality Score improvement corresponded to an approximate 21.29% reduction in CPC.
The implication is straightforward: Quality Score improvements matter most when intent is tightly controlled.
If your goal is to lower CPC through Quality Score optimization, focus on:
Exact Match keywords
High-intent query alignment
Relevance at the keyword–search term level, not the account level
Broad Match may serve scale, but it obscures diagnostics. Exact Match reveals the true economics of Quality Score.
In short, Quality Score works best as a lever when you limit Google’s ability to drift away from the intent you’re actually paying for.
If you had told me a couple of years ago that I could type "a cyberpunk hedgehog making a latte" and get a photorealistic 4K video back in seconds, I would have laughed. But here we are in 2026, and AI video generation isn't just a novelty anymore, it's a massive part of my daily workflow.
This guide leverages my experience to break down how to write, structure, and publish a document that earns trust rather than just demanding attention.
Depending on who you ask, there are anywhere from five to twenty "essential" rules out there. But in my experience, there are really only a dozen “laws” of visual design that matter across every medium. Here’s a guide I’ve created with the elements I find to be the most important, no matter your platform.
I love WordPress for its customizations. Styling code snippets enhances user perceptions. Copy and paste the code below to style your WordPress code blocks.